Standardization is important, but without the proper perspective even standardized data can be misinterpreted; thus, you must ‘bear in mind’ the conditions under which consumption occurred. Weather is not controllable, whereas usage behavior is, and both influence energy consumption.
 With respect to weather, stress exerted on heating and cooling equipment is expressed as heating degree days (HDD) and cooling degree days (CDD) which are calculated by the National Weather Service for selected locations using the following approach. First, the average of the high and low temperatures for a given day is calculated. Next, degree days are calculated with respect to a reference air temperature, generally 65°F. CDD is calculated as the average between high and low minus the reference temperature, and HDD is calculated as the average between high and low minus the reference temperature.
 Another important variable to consider is cloud cover. On cloudy days the earth is heated by sun less than on clear days, but cloudy skies at night trap heat closer to the ground whereas clear skies at night allow that heat to escape. As such, clear skies during the day and nighttime cloud cover reduce stress on heating equipment during the colder months of the year, whereas daytime cloud cover and clear skies at night are ideal for reducing the stress on cooling equipment during the warmer months. Although cloud cover data are rarely available, rainfall (precipitation) data are often available and offer an indication of whether a particular month had extensive cloud cover or not.
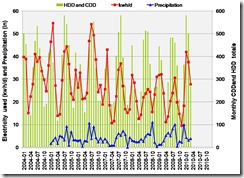
 As seen in this graph, environmental influences have generally been of secondary influence on electricity consumption in my home since 2004. That realization is not surprising given a string of conscious efforts to reduce energy consumption in my home. However, despite the improvements made since 2006, my home is not completely immune from environmental influences under extreme scenarios. For example, I experienced a drastic reduction in energy usage during December 2009 in conjunction with reduced heating degree days (Nov-Dec 2008 vs. 2009) coupled with excessive rainfall/cloud cover. In contrast, I used a lot more electricity in January 2010 than in previous years as a result of a historic cold spell that was also associated with minimal rainfall/cloud cover to buffer that chill.
So, while no insulation effort can remove all vulnerability of a home to drastic weather influences, I would certainly have be worse off if I hadn’t sealed up my home envelope prior to this past winter. Thus, as you seal up your home it’s important to properly interpret your results in the context of the weather so that you (1) don’t over-estimate the extent to which your efforts have reduced consumption, as well as to ensure that you (2) don’t get disappointed if the weather drives your consumption up.
Click here for Step 3
